Smart Stats Analyzer
A Python-based statistical analysis desktop app built with CustomTkinter for students, analysts, and educators. Supports CSV/Excel/JSON input, auto-statistics, visualizations, and PDF/Excel export.
The Problem
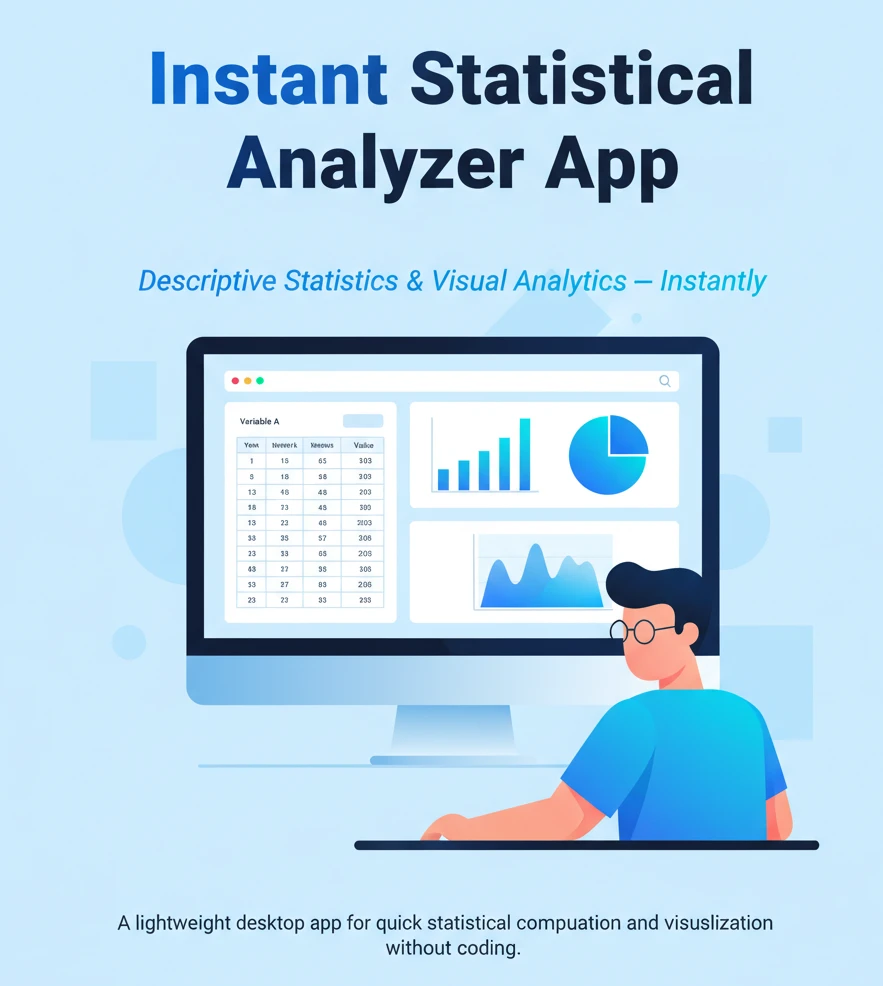
Many students and analysts struggle to compute and visualize statistical measures quickly without coding or complex software. There was a need for a lightweight, intuitive desktop app to perform descriptive statistics and visual analysis instantly.
The Solution
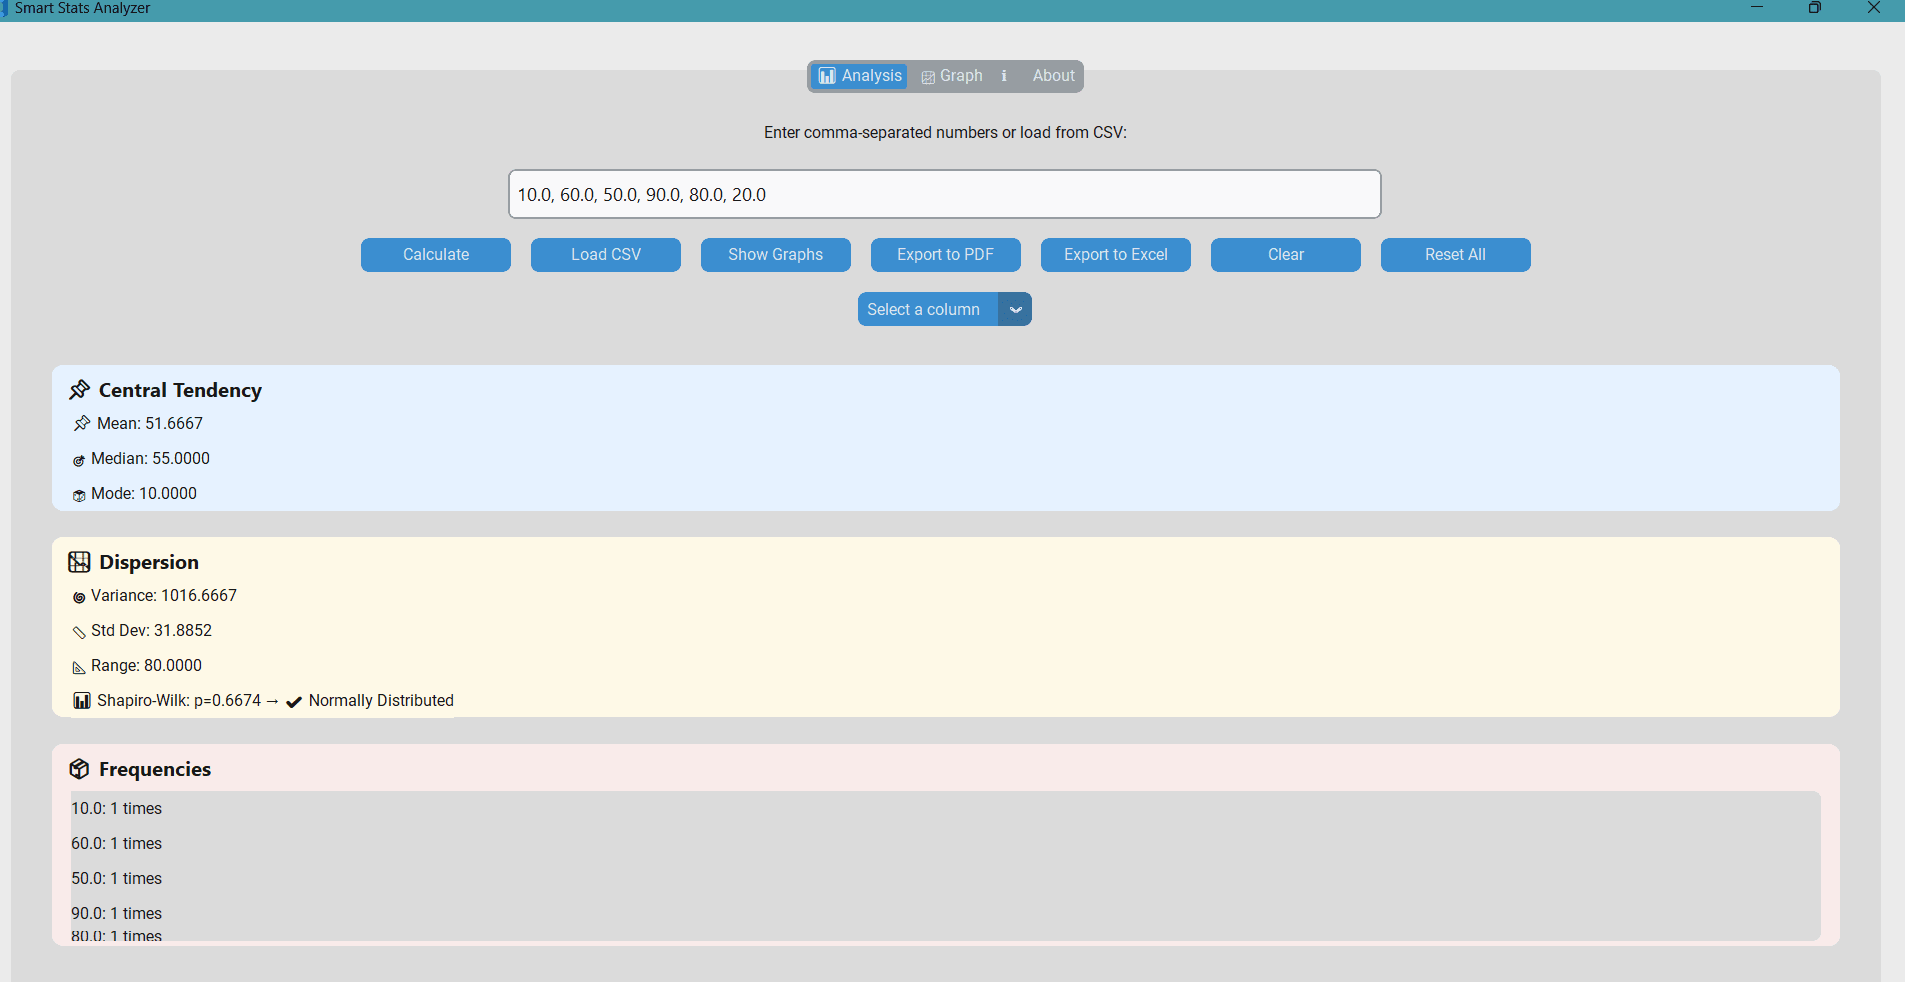
Smart Stats Analyzer is a modern CustomTkinter desktop application that performs real-time statistical analysis on numeric datasets. It automatically calculates descriptive statistics (mean, median, mode, variance, standard deviation, range), tests for normality using the Shapiro–Wilk test, and visualizes results through histograms, boxplots, and pie charts. The app supports importing `.csv`, `.xlsx`, `.json`, and `.txt` files and exporting complete reports to PDF or Excel. It also features light/dark themes, smart reset, and auto-save capabilities.
Data Input
Users can enter numbers manually or import datasets from CSV, Excel, JSON, or TXT files. The system instantly parses and validates data.
Statistical Computation
Automatically computes central tendency and dispersion measures, performs Shapiro–Wilk normality tests, and generates frequency distributions.
Visualization & Export
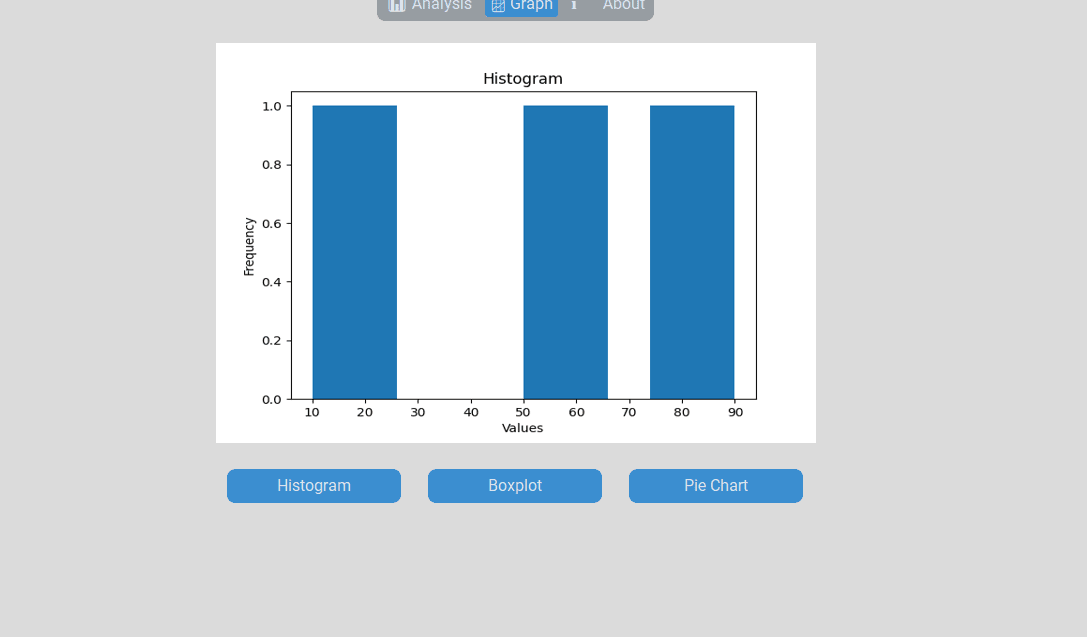
Creates real-time graphs (Histogram, Boxplot, Pie Chart) and allows exporting full analysis reports to PDF or Excel with one click.
Architecture & Features
Modular Python GUI architecture using CustomTkinter for interface, Pandas + SciPy for computation, and Matplotlib for visualization.
- Frontend: CustomTkinter-based multi-tab interface (Dashboard, Graphs, About)
- Computation: Pandas + NumPy for descriptive stats and frequency analysis
- Statistical Tests: SciPy – Shapiro-Wilk for normality checking
- Visualization: Matplotlib for histograms, boxplots, and pie charts
- Reporting: FPDF + OpenPyXL for PDF and Excel exports
Technologies Used
Project Gallery
Future Improvements
- Add correlation and regression analysis modules.
- Introduce multi-variable support and scatterplot matrix.
- Integrate cloud storage sync for saving analysis sessions.
- Add AI-based outlier detection and anomaly analysis.
- Publish cross-platform installer with auto-update feature.